
GLD in Professional & Civic Engagement
I have realized the importance of geospatial data, visualization, and dynamic integrations for use in key performance indicators (KPIs) as well as to help staff, riders, and stakeholders understand complex mappings.
Building upon my interest in cities and urban life meant examining how humans interact with their communities and mapping their behaviors. Geography at the University of South Carolina allowed me to do just that and thus I entered the program completing courses in human geography, cartography, and GIS (Geographic Information Systems). Being able to complete a holistic set of courses has allowed me to touch base on all fields of the discipline. In an attempt to identify issues of cities, I took courses such as Interpretation of Aerial Photographs (GEOG 345 – Fall 2021) and Introduction to Geographic Information Systems (GEOG 363 – Spring 2021) where I learned how to map cities and create powerful reports showing all kinds of detail. I was able to produce large maps on a global scale (World Population Map) and small maps at a local level (Chapin LULC) which gave me skills directly translating to maps created in my internship at The COMET.
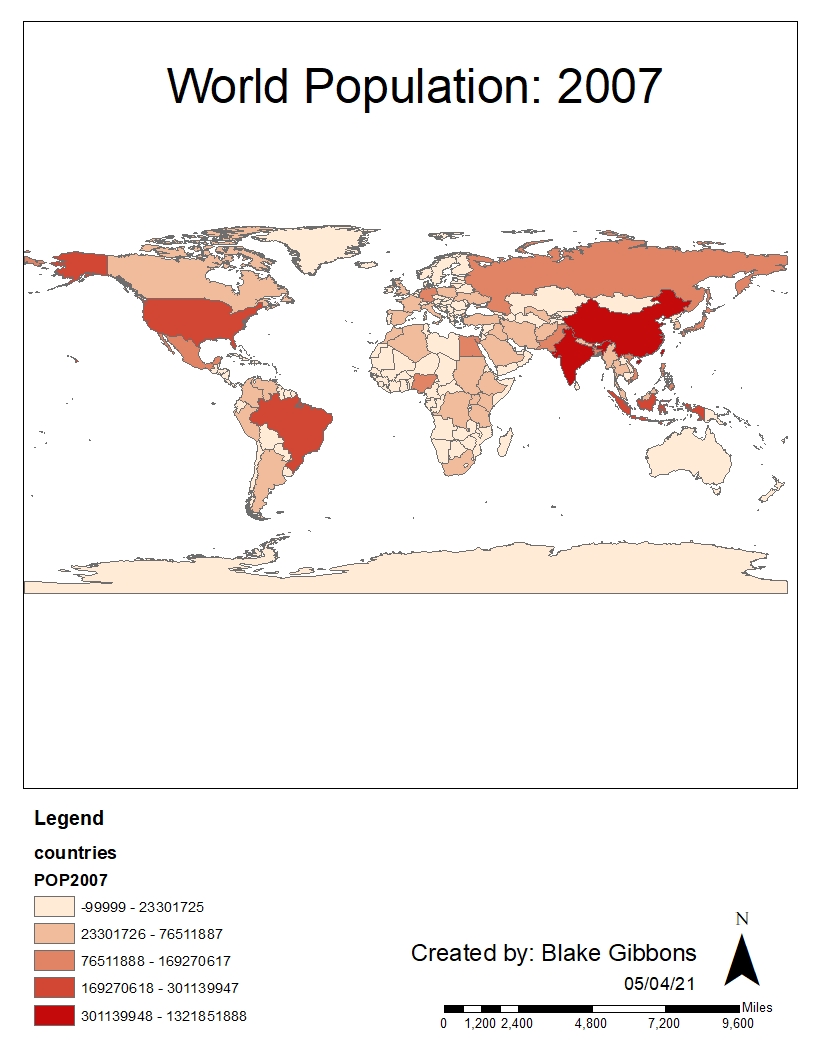
GEOG 363 (Geographic Information Systems – Spring 2021) provided me with my first-ever experience using professional-grade mapping technologies. Prior to enrolling in this course, I had only created rudimentary maps using free online software such as Google My Maps or Open Street Map. ArcMap had a steep learning curve, but this course gave me the skills needed to create basic maps and data analysis. Completing nine hands-on exercises in various aspects of map creation such as organization, data display, analysis, and map exportation culminated in a final project to map the world population based on data from 2007 (WorldPop07). While I look back on this map now and criticize its basic features, this was astonishing to create at the time.
Building upon the technical skills acquired in GEOG 363, I later enrolled in GEOG 345 (Interpretation of Aerial Photographs – Fall 2021) where I gained more GIS skills in addition to understanding how GIS imagery is captured and manipulated into a format for computer systems. We often take satellite imagery and mapping for granted, but this course showed me that imagery is difficult to capture and mesh together accurately. It is important not only to be able to create a map but also to create one that is accurate, visible, and accessible. This all culminated in a final project to map the land use and land cover (LULC) (LULC Map) of a town of our choice of which I picked my hometown of Chapin, SC. LULC maps are important in urban design to understand how much of a town or city is developed by residential, commercial, and industrial.
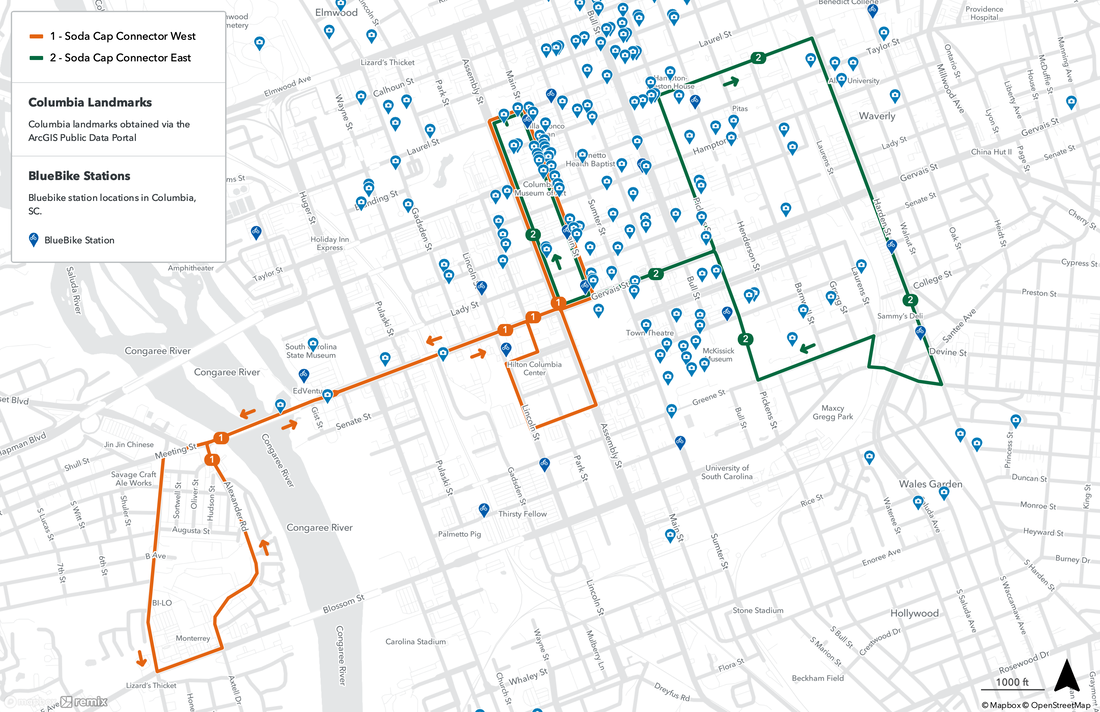
Map created for the January 15th Service Change utilizing Remix Planning software to launch these routes
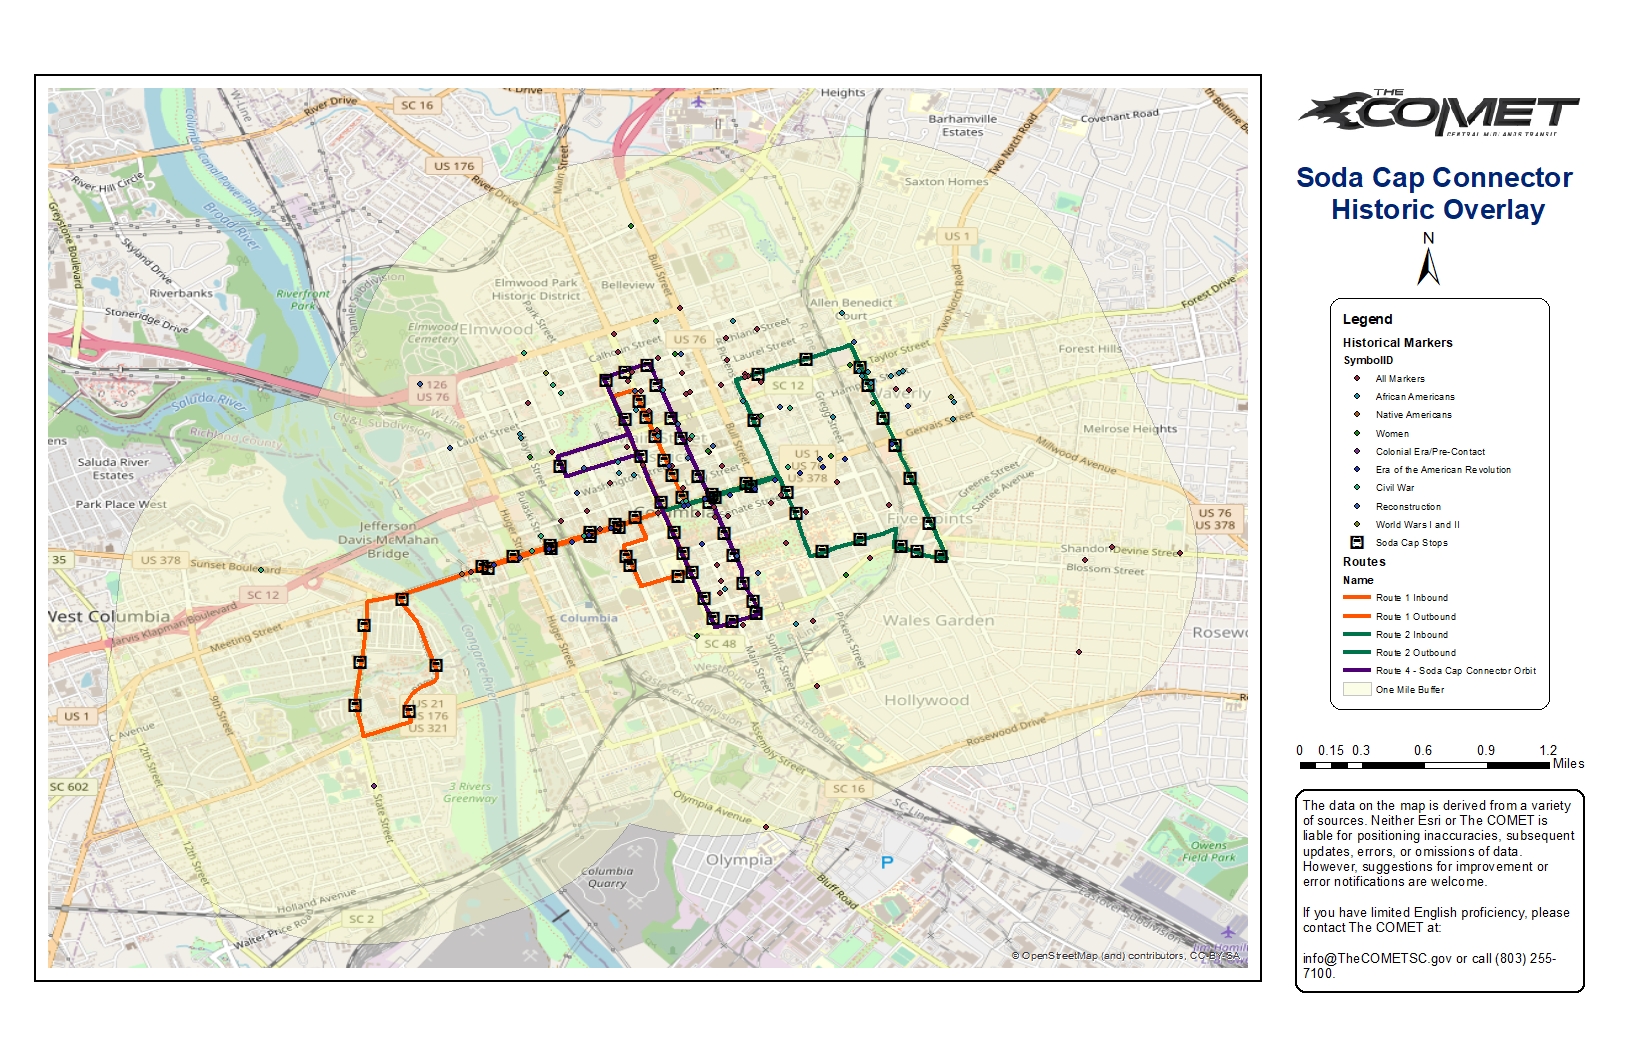
The skills learned from GEOG 363 and GEOG 345 directly translated into my responsibilities at The COMET in which different departments would ask for maps to be created for certain occasions. I have created both static (offline) and dynamic (online) maps for internal and external purposes. One map that stands out is the Soda Cap Historical Overlay project in which I was tasked with showing historical events and markers that were near Soda Cap bus routes which are routes tailored to visitors to Columbia. Using database management, I was able to join data from our Planning Department with data from the SC Department of Archives and History thus creating a visual map that riders can follow along as they are on the bus. This project helped to rebrand the route as simply getting from point A to B and pivoted to an experience where one could learn about Columbia’s rich history all for only $1 fare. While the new routes have only been operational for a few months (launched with Jan. 15 service change), they are already attracting ridership with a gradual rise to meet KPIs for ridership.
After being in planning at The COMET for over two years now, I have realized the importance of geospatial data, visualization, and dynamic integrations for use in key performance indicators (KPIs) as well as to help staff, riders, and stakeholders understand complex mappings. While planning is moving to more cloud-based mapping technologies, learning ArcMap, ArcCloud, and Remix has given me a head start in the transportation industry as creating a powerful map with data sets one apart from another and provides insight into how well an area is performing. I’m excited to continue with map making via open-source channels such as OpenStreetMap and Google Maps as well as more professionally via ArcCloud, ArcMap/ArcGIS Pro, and Remix Planning/Scheduling.
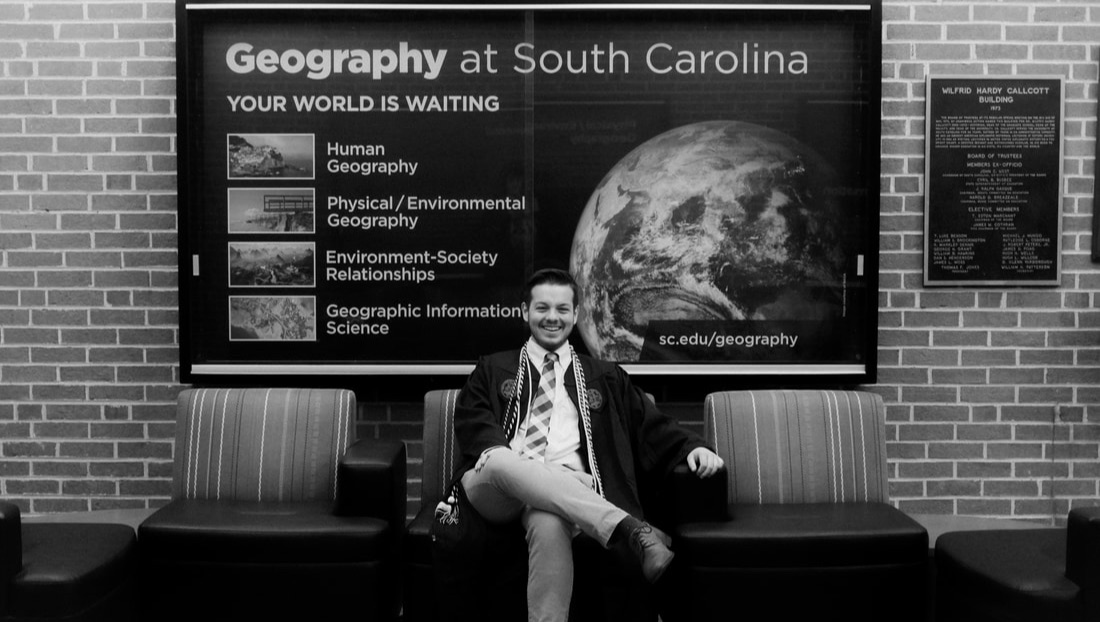
Graduation picture taken outside of Callcott - home of Geography at USC
Artifacts
| Artifact 5: 2007 World Population Map (WTC) |
| Artifact 6: Soda Cap Historic Overlay (BTC) |
Click here to access the dynamic version of this map.
Supporting Documentation
| Chapin LULC (WTC) |
| Routes & Muncipalities Overlay in the Columbia Metropolitan Area (BTC) |
